Monitoring System
The Hypertable Monitoring UI is an invaluable tool that provides insight into the health and operational characteristics of your Hypertable deployment. We highly recommend that you install it (see below) and become intimately familiar with it. This document provides an overview of the monitoring UI and describes how to get it up and running.
Range Servers Overview
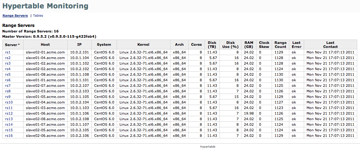
When you first pull up the Monitoring UI in your browser, the first page you come to is the RangeServer overview page. It displays a table containing statistics for each range server in your system. Each row contains statistics for a single range server, including system configuration information, disk use percentage, range count, clock skew, and basic health information. The column on the left gives the range server proxy name and is linked to a page containing RRD graphs of application and general system statistics for the range server. The following lists the RRD graphs provided on that page.
- scans / updates per second
- cells read / written per second
- table bytes read / written per second
- syncs per second
- disk activity - read / write IOPS
- disk activity - read / write bytes per second
- network activity - RX / TX rate
- load average
- cpu user time percentage
- cpu system time percentage
- outstanding scanner count
- cell store count
- range count
- disk use percentage
- virtual memory size
- resident memory size
- pages swapped in / out
- heap size
- heap slack bytes (unallocated memory on free lists)
- application tracked memory usage
- block cache memory / fill / hit rate
- query cache memory / fill / hit rate
Tables Overview
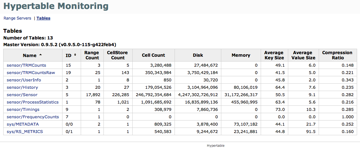
 If you click the Tables tab at the top of the main monitoring page it will bring you to the Tables overview page. Click the image on the right to see an example (data taken from a real Hypertable deployment). This page displays a table of statistics for each table in your system. Each row contains statistics for a single table, including range count, cell store count, cell count, disk use, memory use, average key size, average value size, and compression ratio. The column on the left gives the full table name (including namespace path) and is linked to a page containing RRD graphs of per-table statistics. The following lists the RRD graphs provided on that page.
- scans / updates per second
- cells read / written per second
- table bytes read / written per second
- disk bytes read per second
- outstanding scanner count
- range count
- disk used
- memory used / allocated
- block index memory
- bloom filter memory / accesses / maybes
Installation
The Monitoring UI is written in Ruby and uses the Ruby RRDTool bindings. It requires ruby 1.8.7 or greater. Verify that you are running the correct version of ruby:
If your system has an older version of ruby, you'll need to upgrade ruby and ruby gems. In some circumstances, you'll need to build ruby (and ruby gems) from source, see CentOS 5 Installation (below) for an example of how to do this. Once you've verified that you are running the correct version of ruby, install the required gems as follows.
sudo gem install sinatra rack thin json titleize syck
NOTE: the syck gem is only required for ruby >= 2.0
The next step is to install RRDTool. The following describes how to install RRDTool on various platforms.
Redhat (CentOS)
sudo yum install rrdtool
Debian (Ubuntu)
sudo apt-get install rrdtool
Mac OSX
For the mac, we recommend that you use MacPorts to install rrdtool. MacPorts requires that you first install Xcode. Once you have MacPorts installed, you can install rrdtool as follows.
sudo port install rrdtool
CentOS 5 Installation
The CentOS (Redhat) 5 series of operating systems provides an older version of ruby that is incompatible with the Hypertable UI. Run the following script as root to upgrade Ruby and to get the dependencies set up properly.
#!/usr/bin/env bash

# Upgrade to ruby 1.8.7
yum -y remove ruby
yum -y install gcc gcc-c++ zlib-devel openssl-devel readline-devel sqlite3-devel
wget http://ftp.ruby-lang.org/pub/ruby/1.8/ruby-1.8.7.tar.gz
tar xzvf ruby-1.8.7.tar.gz
cd ruby-1.8.7
./configure
make
make install
cd ~
rm -rf ruby-1.8.7*
hash -r

wget http://rubyforge.org/frs/download.php/69365/rubygems-1.3.6.tgz
tar xzvf rubygems-1.3.6.tgz
cd rubygems-1.3.6
ruby setup.rb
cd ~
rm -rf rubygems-1.3.6*
hash -r

gem install capistrano sinatra rack thin json titleize

yum install rrdtool

/sbin/ldconfig
Starting and Stopping the UI
If you're using ht cluster to administer your Hypertable cluster, no special steps are required to start and stop the monitoring UI. It will automatically start and stop with the ht cluster commands to start and stop Hypertable.
ht cluster start
ht cluster stop
If you're running Hypertable in standalone mode, you need to start and stop the monitoring UI manually as follows.
ht-start-monitoring.sh
ht-stop-monitoring.sh
Accessing the UI
The monitoring UI is accessed through TCP port 15860, either on the standalone machine or on the master machine if running on a cluster. Make sure port 15860 is not blocked by a firewall. If the master machine (called master in the example below) is directly accessible, you can pull up the UI by pointing your browser to the following URL.
http://master:15860/
If you don't have direct access to the master machine, you can create an ssh tunnel that allows you to access the UI. Assuming that you have ssh access to a machine called admin.yourcompany.com which has direct (unblocked) access to the master machine, you can create a bash alias that will setup an ssh tunnel to the monitoring UI as follows.
alias hypertable-monitoring="ssh -f -L 15860:master:15860 admin.yourcompany.com -N; echo 'http://localhost:15860/'"
If you're running a shell other than bash, consult the shell documentation to find out how to setup a similar alias. To create the tunnel, run the alias as follows.
$ hypertable-monitoring
http://localhost:15860/


